Summarize, plot and tabulate a workflow-set run
Source:R/nested-results-agreement.R, R/nested-results-plot.R, R/nested-results-print.R, and 1 more
summary.nested_results_set.RdThese methods read a nested_results_set from nested_workflow_map() as
they read one workflow's run, keyed by wflow_id.
Usage
# S3 method for class 'nested_results_set'
agreement(x, ...)

# S3 method for class 'nested_results_set'
autoplot(
  object,
  type = c("parameters", "performance"),
  metric = NULL,
  eval_time = NULL,
  ...
)

# S3 method for class 'nested_results_set'
summary(object, ...)

# S3 method for class 'summary.nested_results_set'
print(x, ...)
Arguments
- x, object
A
nested_results_setfromnested_workflow_map(). For the print method, thesummary.nested_results_setthatsummary()returns.- ...
Not used, and must be empty.
- type
Which view to draw:
"parameters"(the default) or"performance".- metric, eval_time
For
type = "performance", the metrics and the evaluation times to draw, as onautoplot.nested_results().
Value
summary() returns a summary.nested_results_set, a list of
one summary.nested_results() per workflow, named by wflow_id.
autoplot() returns a ggplot object, and agreement() a tibble with
wflow_id first.
Details
summary() summarizes each workflow's run as summary.nested_results()
does, and prints one section per workflow. A tuned workflow's section
carries the Selected by: and Selecting metric: lines under the rules
that print them. Each nested estimate describes its workflow's tuning
procedure, not a fitted model. For a workflow chosen before seeing these
estimates, its estimate is the number to report for the model that
nested_final_fit() fits with that workflow's id. Choosing a workflow
by these estimates is itself a selection that no outer loop scored.
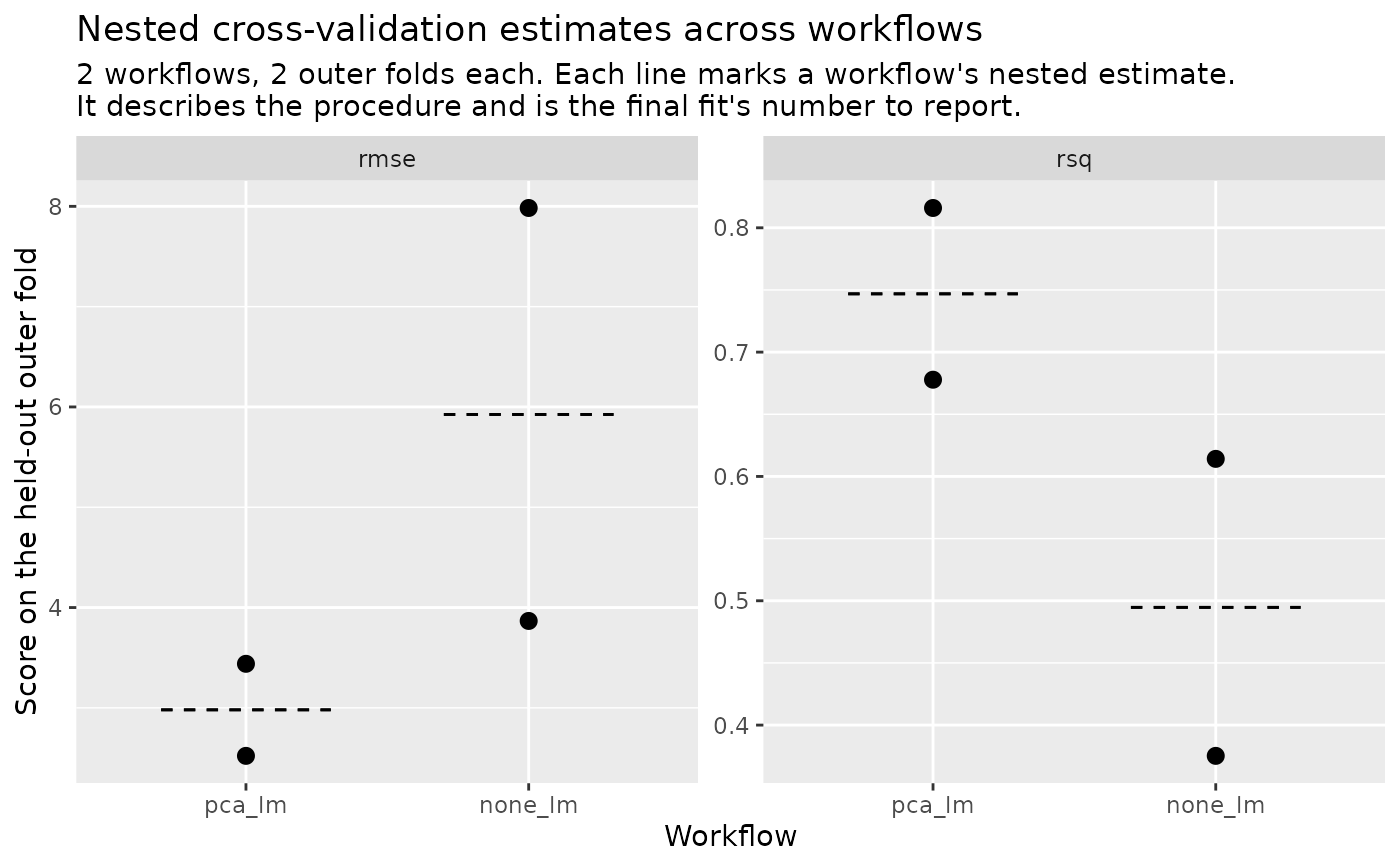
With type = "performance", autoplot() puts the workflows along the x
axis, one panel per metric, with a dashed line at each workflow's nested
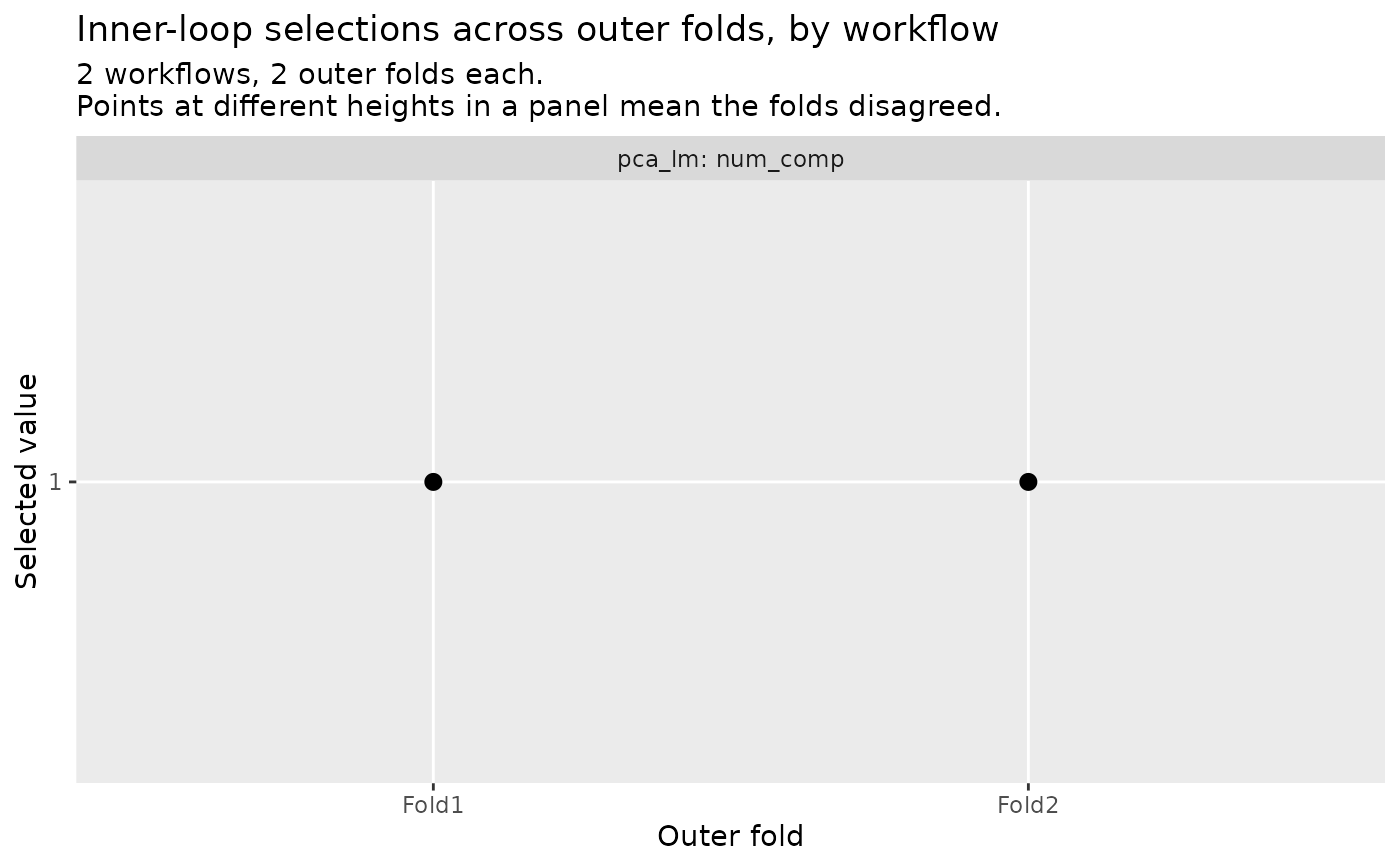
estimate. With type = "parameters", it draws one panel per workflow and
tuned parameter. The subtitle counts the workflows that did not complete
every fold, and those that averaged a metric over fewer folds than they
completed.
agreement() stacks each workflow's table under wflow_id. A
parameter that a workflow does not tune is NA in its rows.
A workflow in which no fold completed is still summarized. The plots draw
nothing for it and agreement() leaves it out, each with a warning.
Examples
data(mtcars)
rec <- recipes::recipe(mpg ~ ., data = mtcars) |>
recipes::step_pca(recipes::all_predictors(), num_comp = tune::tune())
wf <- workflows::workflow(rec, parsnip::linear_reg())
set.seed(1)
folds <- nested_resamples(
mtcars,
outside = rsample::vfold_cv(v = 2),
inside = rsample::vfold_cv(v = 2)
)
# One tuned workflow and one baseline, on the same nested design.
wset <- workflowsets::workflow_set(
preproc = list(pca = rec, none = recipes::recipe(mpg ~ ., data = mtcars)),
models = list(lm = parsnip::linear_reg())
)
set.seed(2)
res <- nested_workflow_map(wset, resamples = folds, grid = data.frame(num_comp = 1:2))
summary(res)
#>
#> ── Nested cross-validation results for a workflow set ─────────────────
#> Orchestrator: `nested_tune_grid()` (grid search)
#> Workflows: 2
#>
#> ── Workflow "pca_lm" ──
#>
#> Outer resamples: 2-fold cross-validation
#> Outer folds: 2 requested, 2 completed
#>
#> ── Selected parameters
#> Selecting metric: rmse
#> ✔ num_comp: 1 (all 2 completed folds agree)
#>
#> ── Estimate (2 of 2 outer folds)
#> rmse (standard): 2.98
#> rsq (standard): 0.747
#>
#> ── Workflow "none_lm" ──
#>
#> Outer resamples: 2-fold cross-validation
#> Outer folds: 2 requested, 2 completed
#>
#> ── Selected parameters
#> ℹ No tuned parameters.
#>
#> ── Estimate (2 of 2 outer folds)
#> rmse (standard): 5.93
#> rsq (standard): 0.495
#>
#> ℹ Each nested estimate describes its workflow's tune-and-fit
#> procedure. For a workflow chosen before seeing these estimates, its
#> estimate is the number to report for the model `nested_final_fit()`
#> builds with that workflow's `id`.
agreement(res)
#> # A tibble: 1 × 4
#> wflow_id num_comp n prop
#> <chr> <int> <int> <dbl>
#> 1 pca_lm 1 2 1
autoplot(res, type = "parameters")
 autoplot(res, type = "performance")